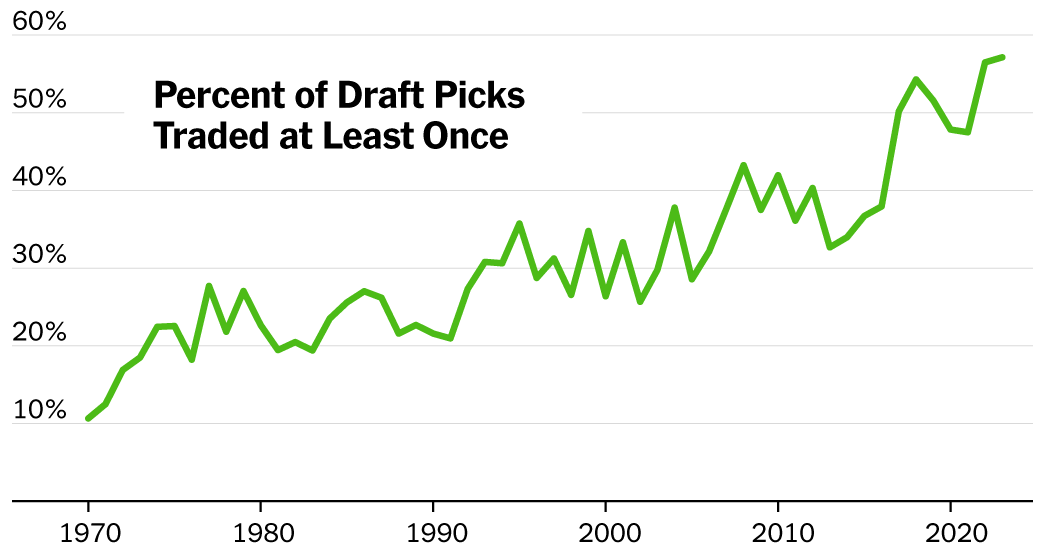
On Thursday night, the Chicago Bears will make the first of many picks in the N.F.L. draft that have something in common: They originally belonged to someone else.
The Bears’ pick — expected to be U.S.C. quarterback Caleb Williams — was acquired last year as part of a blockbuster deal in which Chicago also got receiver D.J. Moore and three other draft picks.
That trade is part of an increasing draft-night trend in the pursuit of “draft capital.” As teams become much more sophisticated in their understanding of how much a draft pick is worth, particularly in later rounds, draft picks have become increasingly common as deal-sweeteners, or to round out intricate trade packages.
In one sign of how firmly this ethos has taken root in today’s N.F.L.: In last year’s draft, for the fifth time since 2017, more picks were traded away than were used by their original team.
In a trade emblematic of the trend, consider the circuitous route of the 230th pick in last year’s draft. That pick had changed hands five times, starting in 2020, before coming to the Buffalo Bills.
After the pick’s long journey, the Bills selected offensive lineman Nick Broeker, who was waived by the Bills before the season.
Teams now often swap picks like a currency, knowing they will be able to trade them again later. About one-third of all swapped picks, since 2020, were traded again at least once more.
Why trading went up
The increase in such swaps can be attributed to two large related trends: Swaps for picks have become more complex, and they have become more popular with the increasing importance of the draft.
More complex trades can be attributed to the spread of the “Jimmy Johnson trade chart,” a system created by a Cowboys minority owner and embraced by Johnson, Dallas’s coach, in the early 1990s. It was one of the first major attempts to quantify the value of draft picks in relation to other picks.
The chart states the No. 1 pick in the draft is worth the same market value (3,000 points on Johnson’s chart) as the total of the third (2,200 points) and 21st picks (800 points). Teams today create their own updated version of the Johnson chart using more sophisticated mathematical models, but the concept is the same.
Johnson himself was known for complex deals, including the 1989 Herschel Walker trade involving six players and 12 picks that helped set the foundation for three Dallas titles.
Mark Dominik, a former general manager who worked for the Tampa Bay Buccaneers for 15 years, said he remembered securing a copy of the trade chart in 1996. He said part of his job at the time as director of pro scouting was feeling out trades, and he would call other teams and ask what point chart they used.
“It was the guide that put teams in the same mentality,” Dominik said. “Some teams didn’t have a draft point chart, and I felt like we got a little bit better value on those trades.”
Trading picks has also become more popular as the value of rookie contracts to teams has increased, caused in part by rule changes.
In 2011, a collective bargaining agreement between the players union and league created a rookie wage scale. In 2009, the contract value of the top overall pick, Matthew Stafford, was $12 million a year. In 2012, Andrew Luck was drafted first overall and received a contract with the new wage scale at just $5.5 million a year.
Because there’s also a limit on total team spending — the salary cap started in 1994 — the rookie wage scale made drafting young players at lower prices even more enticing. The former Jets general manager Mike Tannenbaum said this created a new paradigm: “Over time the market saw how valuable the trades were, but it took a couple years to work out.”
The number of trades today is 50 percent higher than before the rookie-wage-scale era and more than twice as high as it was in the 1990s.
Other rule changes have also shifted trade dynamics. In the 1970s, the draft reached 17 rounds, with teams rarely bothering to trade late-round picks with limited value. And in 2017, the league allowed compensatory picks (those given to teams that lost valuable free agents) to be traded.
Will trading keep going up?
In 2005, the economists Richard Thaler and Cade Massey published a paper examining the market efficiency of the N.F.L. draft. Their research required them to calculate a draft-pick value curve plotting the market value of one pick compared with another, a more mathematically precise version of the Johnson trade chart.
Thaler, who won a Nobel Prize for his contributions to behavioral economics, said in an interview that he believed teams were still not trading as much as economic theory might predict. If the draft were “really efficient,” he said, teams would be trading picks much more often than they do now.
Why aren’t teams doing this? “There is a very strong inertia in all aspects of life,” Thaler said. “We do things the way we’ve always done them.”
Thaler also said fans are more likely to criticize a team for a trade that goes wrong than for standing pat.
But the market alone doesn’t determine trade frequency. Dominik pointed to how the draft was expanded in 2010 — to three days instead of two — giving teams more time to discuss trades.
This year, with 83 picks swapped so far, draft trades are up from the pre-draft total last year in which a record-setting percentage of picks wound up being dealt overall. With speculation surrounding quarterbacks at the top of Thursday’s draft, and with leaguewide trends toward trading, there is a good chance this year will set a new mark for transactions.