Sign up for the GI Daily here to get the biggest news straight to your inbox
As the holidays draw near, it’s the time for us to indulge and feast upon pie… charts. And bar graphs, tables, and other statistics.
I refer to, of course, the annual GamesIndustry.biz Year In Numbers infographic, providing you with a snapshot of where the video games business stands as the year ends (perfect for sounding knowledgeable in any remaining meeting you unfortunately having coming up in the last couple of days before the break).
As always, a huge thank you to the experts that share their data and help us compile this together. In the image below, you will find:
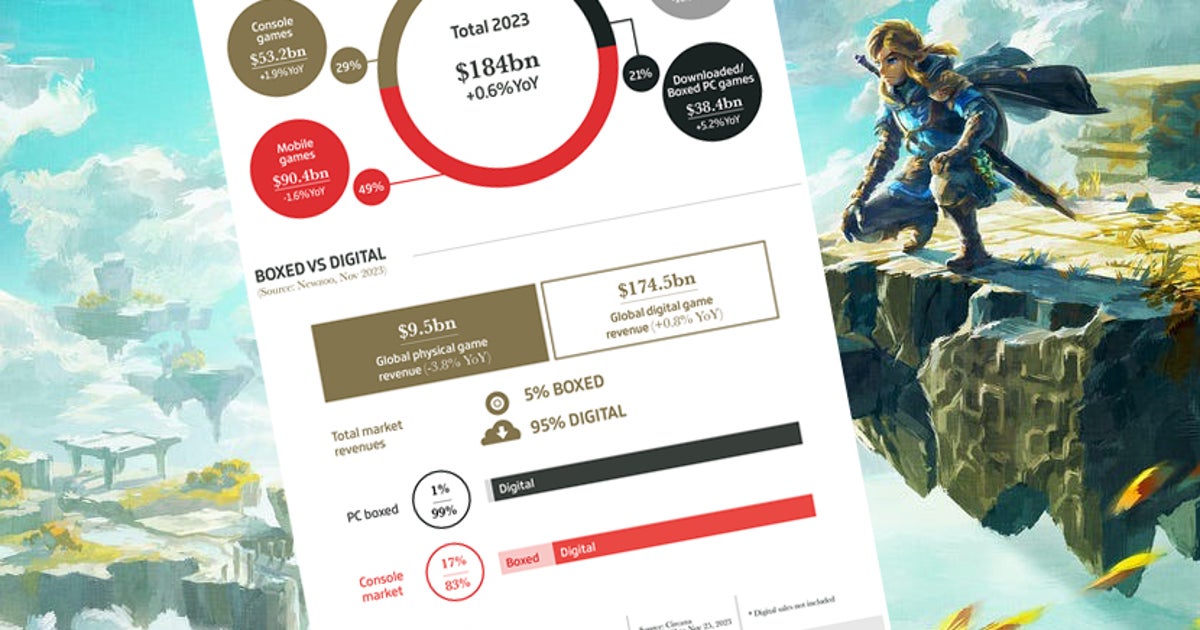
- The global games market value (courtesy of Newzoo)
- Total boxed vs digital revenues (also via Newzoo)
- The biggest mobile games, publishers and countries, both by revenue and downloads (thank you, Sensor Tower)
- The best-selling games in the UK (from GfK), US (from The NPD Group) and Japan (from Famitsu)
- The most covered games and companies, in terms of number of articles (provided by ICO via Footprints, based on data from over 18,000 websites)
- The biggest influencers on YouTube, most watched trailers and game promo videos, and the most popular video games on TikTok (courtesy of Fancensus)
With that, GamesIndustry.biz presents… The Year In Numbers 2023: